Apparatus – Measurement Principle
This experiment is based on the basic principle of measuring the load characteristic, which is based on a standard procedure for measuring the dependence of the output voltage on the current drawn. In this experiment, a solar cell is used as the current source. Its source of electromotive voltage is the light energy falling on it. In order to observe the dependence of the output electrical quantities on the light, the solar cell is artificially illuminated by a light bulb. The light output of the bulb can be adjusted to four preset levels. The scheme of the experiment is shown in Figure 1.
Fig. 1 – Wiring diagram for measuring the load characteristics of a solar cell.
In our remote experiment a K8055 USB board (Velleman) is used to control the measuring device, which is controlled by our K8055-MARIE application. The bulb circuit uses the DA output of the K8055 board converter, whose output current is amplified by the DIY ISES Booster (only Czech). The luminous flux is directed to the used solar cell by a reflector – the system is made on a 3D printer (see Fig. 2).
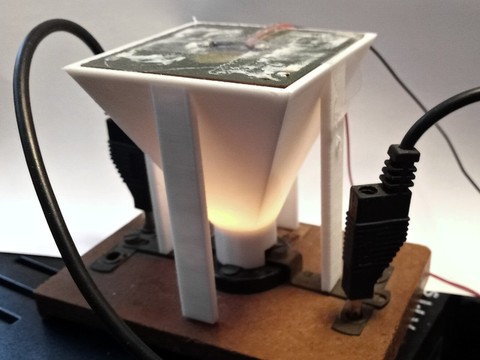
Fig. 2 – Bulb-Solar Cell Configuration (before applying the reflective layer inside the reflector)
The ISES system modules (voltmeters and ammeters) are used to obtain the values of electrical quantities in the detection part of the device, i.e. in the voltage and current detection circuit. For this purpose, ISES-ZOMBIE (only Czech) is used, which enables the connection of two ISES measuring modules to the K8055 board.
The bulb circuit is complemented by a reed relay that detects the current flowing through the bulb circuit. The state of the relay is read by one of the digital inputs of the K8055 board. If the filament of the bulb burns out, this condition is detected on the instrument panel.
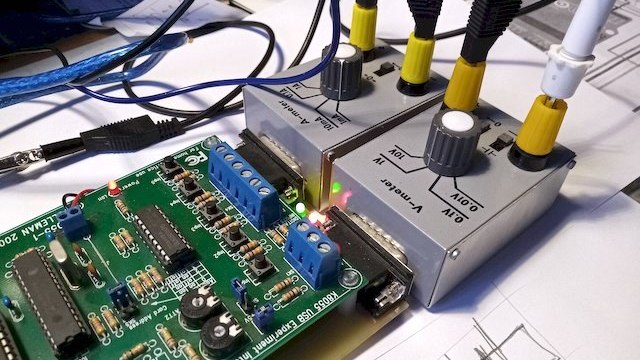
Fig. 3 – ISES ZOMBIE module used to connect two ISES modules.
A digital resistance decade is used in the role of a remotely adjustable load rheostat controlled by eight digital outputs of the K8055 board. It is a power-adapted resistor decade whose resistors can be switched on and off by means of eight relays controlled by the aforementioned digital outputs of the control board. Thanks to this, it is possible to set 256 possible values for the load rheostat. This is a sufficient number of values to measure different output currents.
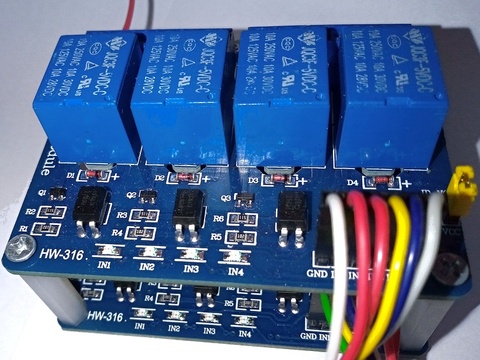
Fig. 4 – Resistor decade module for source load (consisting of a pair of four relay boards)
The above-mentioned functional blocks of the measuring device are connected to the K8055 control board according to the block diagram in Fig. 5. The power supply BK126 is used to supply the power parts of the task. The coils of the eight digital rheostat relays are also supplied from this source. The ISES ZOMBIE input module is powered by the modified K8055 board – a description of this modification is given in the article: ISES – Z.O.M.B.I.E. on our publication website Fyzikální kabinet FyzKAB. (both links in Czech only)
Fig. 5 – Block diagram of the measurement apparatus of the D.E.V.I.L. experiment.
The measured experimental values (electrical voltage Ucell and current Icell) are read and displayed on the control panel in a web browser on the client side. The measured values can be stored in a table and continuously displayed in a graph. This display is mainly used for an approximate check of the accuracy of the measured data, or to find the places of the characteristic where it is necessary to measure the required data. For complete processing according to the assigned work task, it can be downloaded to a computer and processed in any spreadsheet program.
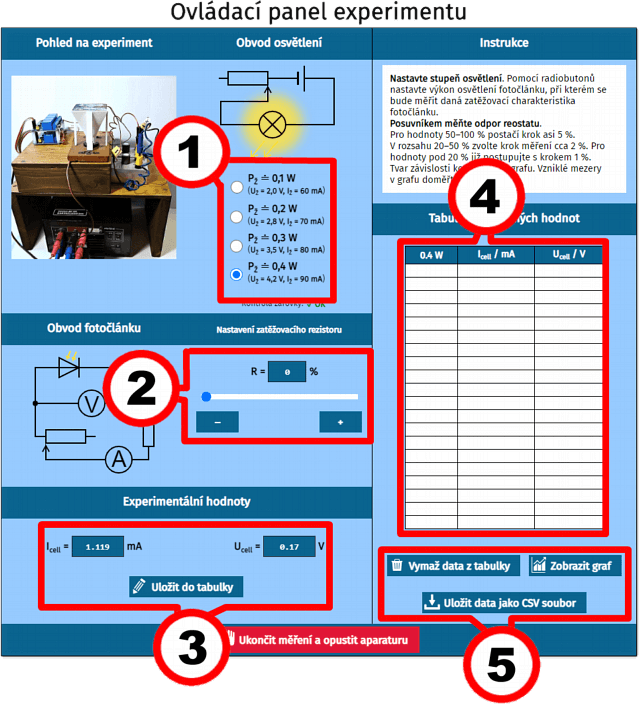
Control of the experiment
Solar cell illumination – for measurement you can select one of four levels of solar cell illumination.
Solar cell load – a rheostat is used to adjust the current drawn from the solar cell, which can be controlled by this slider.
Experimental data – the measured values of voltage and current are displayed and can be saved in the table.
Table of experimental data – a table of experimental values (electric current, voltage), which can be used for further processing.
Table data processing – the data in the table can be displayed in a graph, saved to a computer for further processing, or the table can be cleared and measured again.