Apparatus – measuring principle
The weather station in our remote laboratory is not used for weather forecasting. The station is primarily intended for remote monitoring of conditions in the laboratory. It is therefore not worthwhile for us to measure, for example, wind speed or the height of snow cover. In our remote experiment (meteorological station), we focused only on measuring three basic meteorological variables – temperature (in the laboratory), air pressure (which we convert to sea level) and relative humidity. Throughout this task, we want to show the simplicity of building a remote experiment and motivate other creators to build a similarly designed remote experiment, which is built on the Arduino module with an Ethernet Shield expansion block (see section For developers).
We realized that the most challenging moment when creating a remote experiment is programming the remote access to the Arduino module as well as controlling the connected sensors. Not every remote task enthusiast needs to be proficient in Arduino programming and still be able to create a control server immediately. For this reason, we started looking for a simple solution to program the Arduino module. The starting point was the "children's" development environment mBlock. At first glance, this environment may seem to be more primarily focused on the initial teaching of children's programming, but beware! Its possibilities have a considerable overlap, so it can also be used as a tool for developing Arduino module.

Fig. 1 – Combining the mBlock development environment for Arduino module programming seems to be a good choice.
The program is compiled graphically using blocks that fit into each other, in the mBlock development environment. Logical assembly of function blocks into a program structure thus does not require knowledge of the syntax of any programming language. This environment also allows you to import many extensions for individual measuring sensors and Arduino module extensions – for example, for air pressure sensor, thermometer… The mBlock environment together with our extension for Ethernet Shield allows you to create code for remote internet control of the Arduino module. The control program then looks similar to the sample control program in Figure 2.
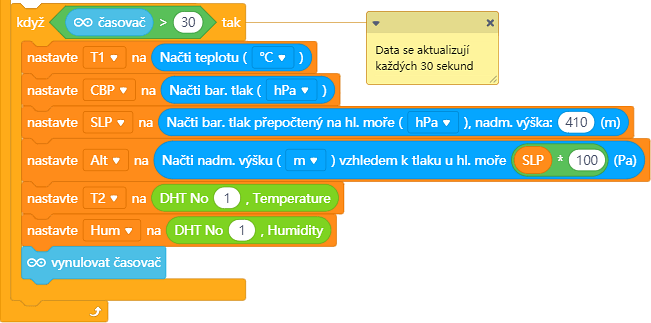
Fig. 2 – Example of a control program created in the mBlock environment
The remote task GENIE is programmed in the mBlock environment and is basically based on the article: Internet meteorological station for non-programmers (only Czech), in which we describe the entire construction in detail. Of course, for the needs of this remote laboratory, the task is slightly modified compared to the article. However, the basic principle of electronic connection (here extended by the RTC real-time module &ndashl see Fig. 3) and the basic structure of the control program are the same as in the mentioned article. The diagram of the electronic part of the whole GENIE apparatus can be seen in Figure 3.
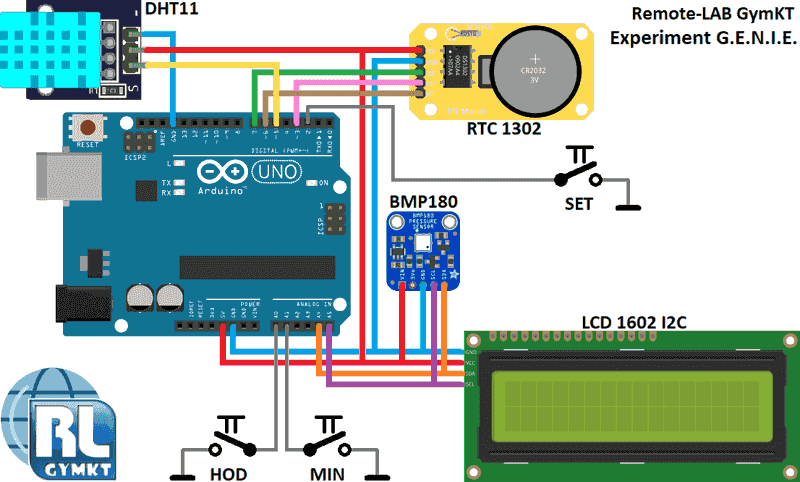
Fig. 3 – Scheme of measuring apparatus of the GENIE experiment
The Arduino module "sandwichly" connected to the Ethernet Shield (shield not shown in Fig. 3) is connected to two basic measuring modules – the BMP180 module (barometric sensor and thermometer) and the DHT11 module (thermometer and relative humidity sensor). In order to be able to read the measured values at a specified time and store them in the 24-hour history, the Arduino module is supplemented by the RTC module DS1302 (real-time module), which serves as a time backup. A two-line LCD display is used to output information such as current temperature, barometric pressure, relative humidity, current time, assigned IP address of the school network and IP address of the currently connected client, which is supplemented by an I2C converter for easier communication with the Arduino module. Three buttons are used for manual time correction, such as changing summer/winter time or occasionally correcting the instability of the RTC module used. The SET button calls up the dialog for changing the time setting, the HRS and MIN buttons then enable this change of the internal time of the Arduino module.
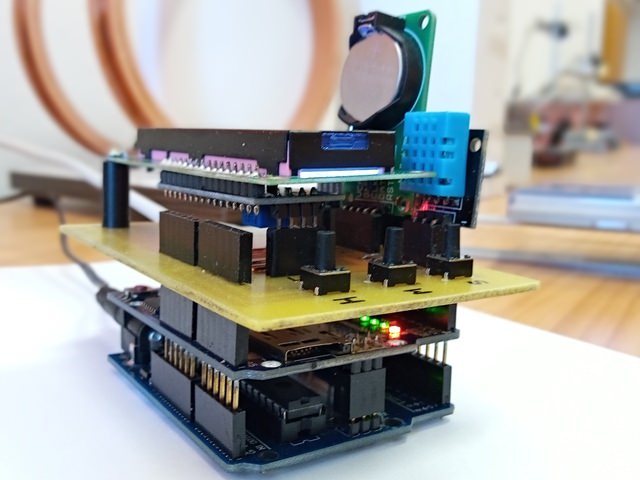
Fig. 4 – Measuring apparatus of the GENIE experiment
You can see the arrangement of the whole task in Figure 4. The basis is the Arduino UNO module (bottom), in which the control program created using the mBlock environment is installed. The Ethernet Shield internet module is inserted from above into the Arduino module, which ensures communication via the school LAN with connected users on the Internet. In the next layer, a motherboard is inserted into the through connector of the Ethernet Shield module, which is equipped with connectors for measuring sensors, an RTC module and an I2C converter for the LCD display. There are also three control buttons SET, HOUR and MIN. The last layer consists of an LCD display connected to the I2C converter and measuring modules, which are plugged vertically into the connectors on the motherboard. The entire measuring instrument block is powered by a 9 V/1 A adapter.
Control of the experiment
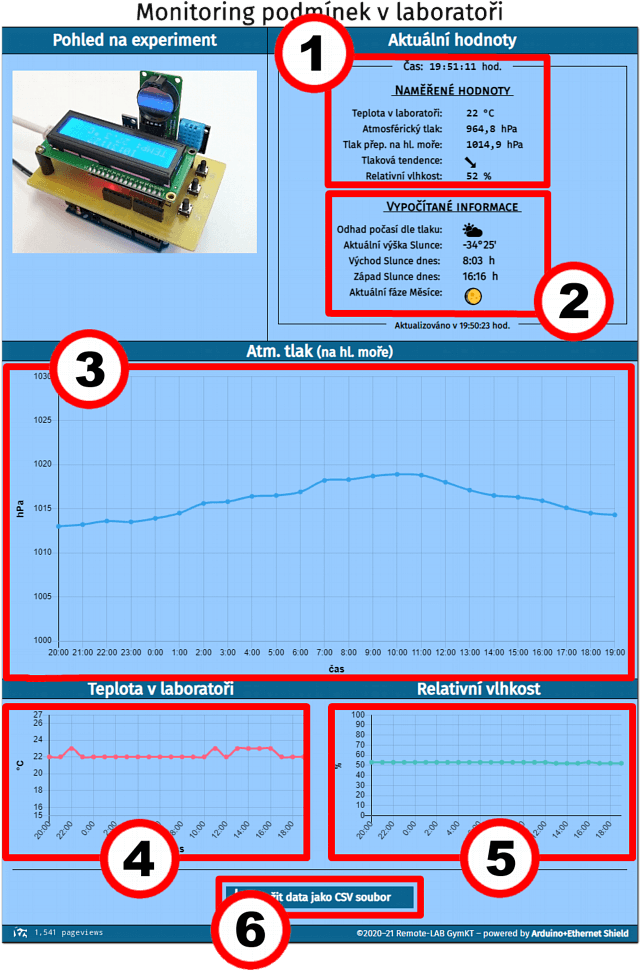
Current measured values – the task bar displays regularly updated values of temperature, local absolute pressure, barometric pressure converted to sea level and relative humidity.
Calculated information – from the current value of pressure the weather forecast is estimated, there is also a calculated angular height of the Sun in the sky, times of sunny sunrise and sunset and the current phase of the Moon.
Graph history atm. pressure (at sea level) – graph of the 24-hour history of the development of the value of barometric pressure converted to sea level.
Temperature History Graph – graph of the 24-hour history of temperature value development in the laboratory.
Relative Humidity Graph – graph of the 24-hour history of the development of relative humidity in the laboratory.
Saving of measured data – current values as well as a 24-hour history of all values can be saved for further processing in the form of a CSV file.