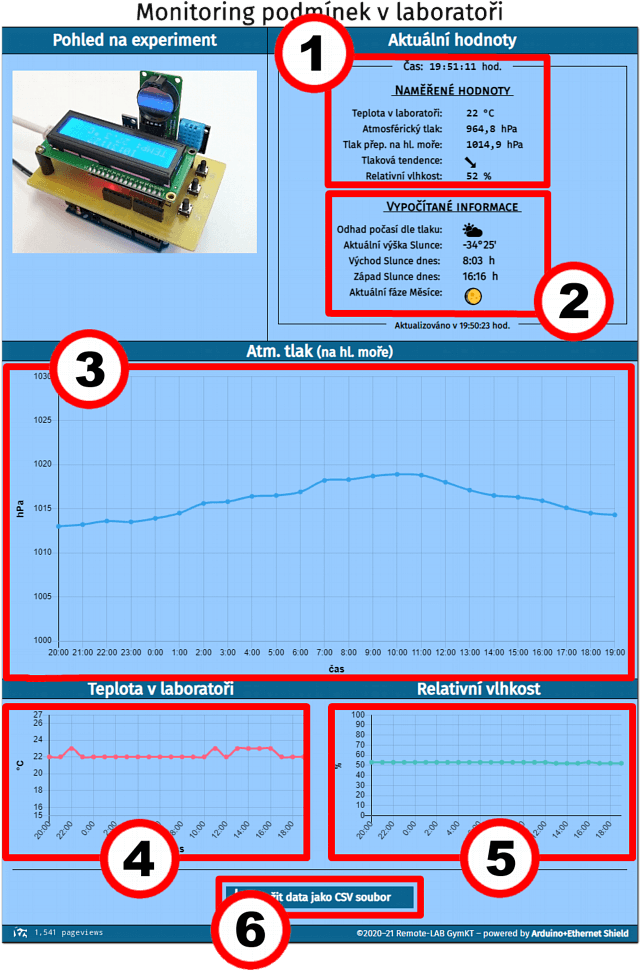
Current measured values – the task bar displays regularly updated values of temperature, local absolute pressure, barometric pressure converted to sea level and relative humidity.
Calculated information – from the current value of pressure the weather forecast is estimated, there is also a calculated angular height of the Sun in the sky, times of sunny sunrise and sunset and the current phase of the Moon.
Graph history atm. pressure (at sea level) – graph of the 24-hour history of the development of the value of barometric pressure converted to sea level.
Temperature History Graph – graph of the 24-hour history of temperature value development in the laboratory.
Relative Humidity Graph – graph of the 24-hour history of the development of relative humidity in the laboratory.
Saving of measured data – current values as well as a 24-hour history of all values can be saved for further processing in the form of a CSV file.


