Apparatus
Common emitter circuit
The task is designed to be able to measure the output (collector) characteristic and the transfer (current) characteristic, in particular to determine the current gain of the common emitter configuration β – defined by equation (1). For those interested, the job is likely to be expanded in the future, as well as the possibility of measuring the input transistor characteristic.
One way to measure this role is based directly on the principle of a transistor. A second NPN transistor is connected in a common emitter configuration (see Fig. 1). When connecting the transistor, the emitter in the emitter junction is biased forward and the collector in the reverse direction. The base circuit and the collector circuit have a common terminal of the transistor – emitter (hence the name: the common emitter circuit).
Fig. 1 – Common emitter circuit diagram
In circuit transistor emitter can achieve maximum power gain compared with other activations transistor because there amplifies the voltage and current. Power amplification can then take values from 103 to 104. That is why the common emitter circuit is so often used.
Transistor Characteristics
Measurement of transistor characteristics is the measurement of the electrical element called two-port. We measure the dependence of input voltage UB and current IB (base circumference) and the dependence of voltage UCE and current IC on the output (collector circuit). Searched characteristics are determined by interaction between these variables – of course, precisely specified under applicable definitions of transistor characteristics (e.g. the necessity to maintain a constant voltage, etc.).
The 2N3055 bipolar transistor was used for this experiment. This transistor is often used as a power output stage in various amplifiers. These transistors and their characteristics are well documented. It is therefore possible to experimentally obtain values that compare well with those in the catalog or datasheet. Furthermore, the limiting parameters are far the maximum voltages and currents that can be achieved in this experiment, a remote – therefore there is no risk of damage to the transistor, and even in case that the remote experiment accidentally unchecked.
Apparatus
The 2N3055 transistor is connected to the experimental USB board K8055 (see Figure 2). The voltage-based transistor is configured using the output of the first DA converter USB board K8055. The next DA output of the same experimental board serves as a variable source voltage for the collector circuit. This allows you to adjust the size of both the voltage to the known values. Both DA outputs of the USB board K8055 are boosted, the current for the collector circuit is added from an external power supply. Conversely, for reading electrical values is a pair of inputs AD converters, which is also equipped with a USB experimental board. These ADCs are used as amperemeters to load the currents flowing in the two circuits and as voltmeters to measure the voltage between the collector and emitter UCE.
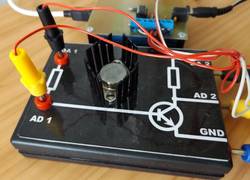
Fig. 2 – Connecting the transistor to the inputs and and outputs of the K8055 board
The control panel allows a pair of sliders (see below) to be used to adjust the voltage at the base and collector. It is therefore also affected by the size and magnitude of the base current voltage between the collector and ground, thus allowing adjustment of voltage UCE between the emitter and collector. Subsequently, it is loaded on the control panel real size of electric currents and voltages UCE (or base voltage UB).
The measured data are stored in several different tables (each for one possible measurement of the characteristic). These series of values can be graphically displayed directly on the control panel, or individually saved as a CSV file and then processed in any spreadsheet program.
This experiment is not equipped with a webcam because in this experiment the apparatus cannot observe anything specific.
Video tutorial
TURN ON THE SUBTITLES IN THE VIDEO TO SEE THE DESCRIPTION AND EXPLANATIONS!