Apparatus
Measurement Principle
The measurement method here is based on the basic configuration of the experiment, similar to the other tasks in our remote lab. This is a classical diffraction experiment, dealing with Fraunhofer diffraction. A source of coherent single-frequency light (laser) illuminates a diffraction element (optical grating). The scattered rays are focused by a coupled lens onto a detection surface where a diffraction pattern is formed. The pattern is either simply displayed or somehow retrieved and rendered. The standard way of loading the diffraction pattern is often to move the detector linearly across the detection surface. The output of the diffraction pattern data read in this way is the dependence of the light intensity on the distance of the location from the position of the zero maximum. However, the condition for the diffraction maxima is the same as for the scattering angle of the rays. This angle must then be calculated from the position of the diffraction maximum and the distance of the detection screen from the diffraction element.
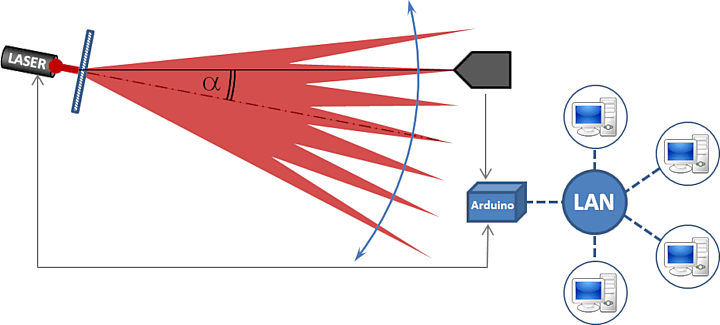
Fig. 1 – Block diagram of the measuring apparatus.
We chose a slight modification of this concept to make this task (at least) a little original in its design. Instead of a linearly moving detector, we use a fixed detector, and instead we rotate the whole part of the apparatus with the laser and the diffraction element. This gives us a direct dependence of the light intensity on the angle of rotation (scattering angle), which can be applied directly to the diffraction maximum condition. Compared to our original concept, where we wanted to rotate the detector on a rotating arm, this solution helped us, among other things, to reduce the overall space requirement of the experiment.
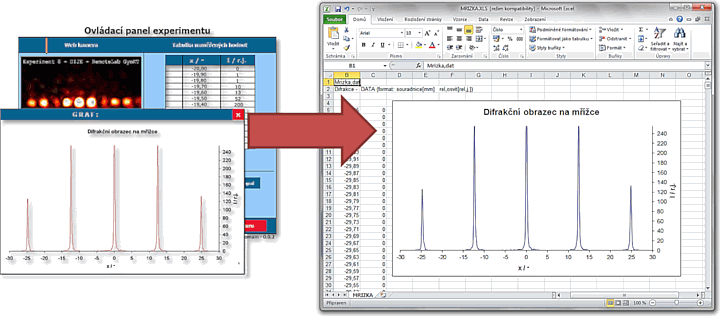
Fig. 2 – preadsheet processing of experimental data.
The values of the measured variables, i.e. rotation angle and light intensity, are sequentially read, stored in a table and displayed in a graph on the control panel. The continuous display of the values in the graph directly on the measuring panel of the task is mainly used for orientation check of the accuracy of the measured data, for further processing it is necessary to save the data in a CSV file and then process it in a spreadsheet or other specialized software.