The measurement principle of this role is based on the standard method of measuring the V-A characteristics of the electronic element. With the variable power changing voltage on the measuring element (here LED) and amperemeter, which is connected in the circuit subtracting the size of the electric current. For the measurement of diodes in the forward direction, the circuit even includes a protective resistor to prevent a steep current increase and subsequent destruction of the diode after exceeding a threshold voltage. The schematic diagram of the electrical circuit is shown in Figure 1.
Fig. 1 – Schematic diagram of the experiment for measuring the V-A characteristics of the LED
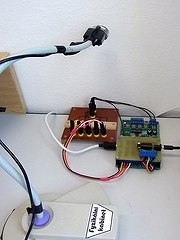
We start from the same scheme in the case of our remote experiment CEcIL. The regulated power supply and measuring instruments replace the measuring USB board K8055. The digital-to-analog output is current amplified and serves as a regulated power supply with a maximum voltage of about 5 V. A pair of analog-to-digital inputs are used as a pair of voltmeters. One measures the voltage across the LED, the other measures the voltage across the ballast (protective) resistor. Knowing the voltage across a linear element (resistor), Ohm's law can be used to determine the current flowing through the resistor. This is due to the serial connection (see schematic – Figure 1) is the same as the current in the whole circuit, so the current through the LED. Five digital outputs of the K8055 card are then used to select one of five LEDs to be measured. The effect of the passing current (e.g. the LED or the rate of sunshine) can be observed via a webcam.
Both values, i.e. voltage ULED and current ILED, are retrieved and displayed on the control panel in the web browser on the client side. In this way, the measured values can be stored in a table (file) and continuously displayed on the graph. Continuous display of values in the graph directly on the measurement task panel is mainly used to check the accuracy of measured data and to find the characteristics of places where it is necessary to assess the tax required data. To complete the processing of the specified task, the data can be saved to your PC and then processed in any spreadsheet program.