Language


Grammar School
of J. Vrchlicky,
Klatovy
of J. Vrchlicky,
Klatovy

- Temperature Dependence of Resistance of Metals and Semiconductors
- Determination of the Earth's magnetic field
- Robotic arm remote control
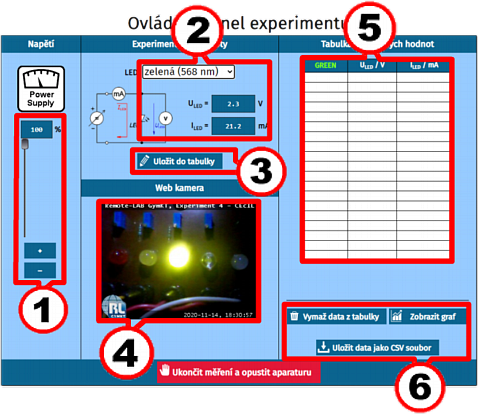
- V-A Charakteristics of LED
(Determination of Planck's constant) - Oscillations on the spring
(forced & damped oscillations) - Basic features of the bipolar transistor
- Classic bulb V-A characteristic
- Load characteristic of the source
- ⏳ Study of diffraction phenomena
(Diffraction on a grating) - Solar cell load characteristics
- ⏳ Radiation Absorption in Materials
- Weather station
- App for remote K8055 control