Apparatus
Measurement Principle
The measuring principle of this experiment is based on a standard measuring procedure. A spring oscillator, consisting of a spring of stiffness k and a mass of weight m, is deflected from its equilibrium position. In the case study, the oscillations are damped enough to "swing" the system, then stopped, and the oscillations are observed. Damping coefficient δ can be determined from the time recording instantaneous deflection of quasi-periodic motiont (damped oscillation). If we study the amplitude at the excitation frequency (forced oscillation), we will follow the course of the instantaneous deflection at different excitation frequencies of the exciting force.
In both cases (damped vibration and forced vibration), the excitation force is generated by a magnetic force. A neodymium magnet is glued to the underside of the weights. Coil with ferromagnetic core is fixed under the vibrating are boiled (see diagram principle – right). The electromagnetic coil is supplied with alternating current of variable frequency. It reaches different frequencies of excitation power. The system is also equipped with a damping element for the possibility of measuring the damped oscillations. It also serves as a protection against uncontrolled increase of resonance amplitude.
The coil is powered by an AC controllable power supply for the excitation frequency changes required by the computer. Control signals for the resource, as well as immediate load deflection oscillator operates experimental kit ISES. This kit has several input and output ports, which can connect various experimental modules - voltmeter, amperemeter, the strain gauge… etc. Experimental system ISES is supplemented by a software kit iSES Web Control, which is created for the use of remote tasks management.
Measurement Procedure
We start the measurements by studying the damped oscillation. We choose the situation (by changing the excitation frequency) when the spring oscillates with sufficient amplitude. The frequency at this moment is given by the frequency of the excitation force. The oscillator starts to oscillate with free vibrations – frequency given by (3) – when we switch off the excitation force (the excitation frequency is set to 0 Hz). We activate the data recording and observe the gradual reduction of the maximum deflection of the oscillation.
The recorded data can be loaded into any spreadsheet program (MS Excel, OO Calc, etc.), where the experimental data can be further processed. We can deduce the value of the maximum deflection (see figure above), which decreases exponentially. You can determine the damping coefficient δ by calculating the exponential regression, which can be done in a spreadsheet.
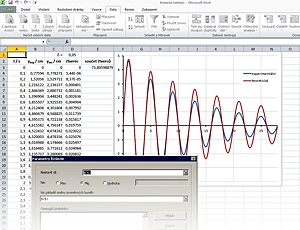
The other (more complex) option is to let damping factor δ calculate the using a spreadsheet Solver extension. Quantifying can be performed from the values of maximum deflections or from across the dependence of immediate displacement. In this case the experimental data except for the immediate displacement calculate the theoretical data from equation (4), wherein the damping coefficient is about a selected parameter.
For the best estimate of the damping coefficient we again use the Solver (Excel extension). We express the sum of squared differences of experimental and theoretical values (so-called squares) – mathematical model designed by equation (4). Solver tool, then enter the task of finding a damping coefficient (or the frequency) to the sum of squared deviations (squares) two series of minimum values. We then enter into the Solver tool the task of finding a damping coefficient (or the frequency) so that the sum of squared deviations (squares) will be minimal. We obtained these parameters mathematical model that will determine what compliance does not improve theoretical measurements and theoretical assumption damped oscillations, after a successful calculation.
We will observe the amplitude oscillation depending on the frequency (or angular frequency) of the excitation forces in the case of a forced oscillation – see equation (5). We'll read or record the maximum deflection throughout the instantaneous displacement, from which we'll get the amplitude during further processing, at different excitation frequencies. The goal is to get as much data as possible to create a graph of maximum deflection versus excitation frequency.
We can directly observe this dependence qualitatively with a webcam in a real experiment. Then we will use the obtained experimental data for a qualified qualitative estimation. For comparison, our estimates and experimental data can again be used in a spreadsheet, where the real data can be compared with values obtained from expression (5) or (6).
Video tutorial
TURN ON THE SUBTITLES IN THE VIDEO TO SEE THE DESCRIPTION AND EXPLANATIONS!